Where the YAC went
Ah Yat is throwing it as far as he did last year. The yards after the catch left with Money Mike, mostly.

Where the YAC went
Ah Yat is throwing it as far as he did last year. The yards after the catch left with Money Mike, mostly.
The Ah Yacht Club: don't blame the captain
Andrew Schmidt read the column, got to the line about not replacing Michael Wortham, and asked the right question.
@ASchmidtacular on Xhttps://x.com/ASchmidtacular/status/2102418846619684957
During every game the stat crew writes down where each completion was caught and where every incompletion hit the turf. Subtract the catch spot from the line of scrimmage and you have air yards; whatever the receiver adds from there is yards after the catch, YAC. Look at every pass attempted, whether caught or not, and you can calculate how far down the field the intended receivers were, which is called average depth of target, aDOT.
That’s a lot of fancy terminology Schuyler, who cares? The more YAC, the more the receivers are making plays with the ball, less puts more on the QB and rushing game to make up the difference. aDOT tells us the nature of the passing game, things like how often do we attack down field, is the offense more conservative or are the long ones just not completed?
I derived both of these stats for last season's fifteen games and this season's four, and it tells much of the story why the offense has not looked as electric this year.
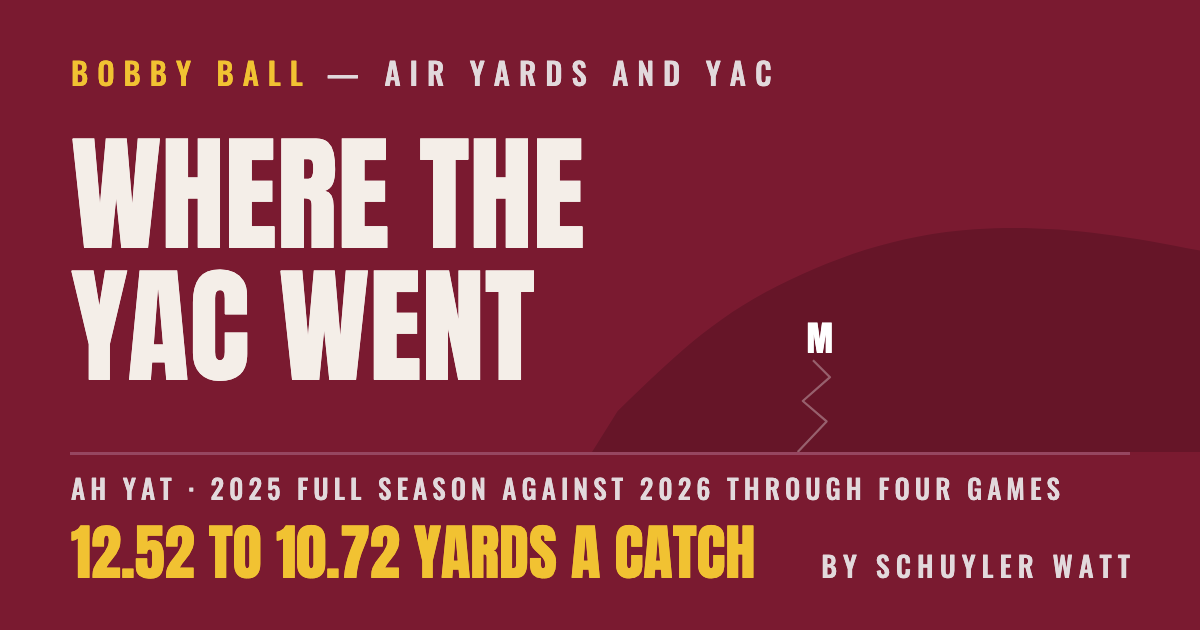
Last year we averaged 12.5 yards-per-completion (YPC). This year has been only 10.7. There are two potential causes: receivers running shorter routes or receivers gain less YAC. In our case, this year's completions are 0.4 yards shorter: 5.8 air yards a catch then, 5.4 now. 24% of the decrease. The YAC is where we are losing out: 6.7 a catch last year compared to 5.3 so far this season. 1.4 YAC less per completion.
A 1.4 yard per catch decrease may not exactly sound like much, but it's massive. For context, this amount is the difference between being in the top ten percent of the country or the bottom half. PFF charts it a little differently and lands in the same place: our receivers were 7th of 129 FCS teams in yards after the catch last year and are 65th of 123 this year. Here’s a simple example. Picture a situation where we rush on first and second down and end up in a third and 9. Last year, we’d complete that pass, gain a little over 9 yards and move the chains, increasing our odds to score. This year that same completion goes for only a little over seven, we end up in fourth and 2, either punting or going-for-it, both of which add fewer to your score on average.
Now repeat that same chain of events over the 94 completions he’s had this year, and that’s 94 instances we gain nearly 2 yards less than last year. Put last year's YAC back on those same completions and it's 129 more yards: 1,137 on 143 attempts, 7.95 an attempt, around the 75th percentile of qualifying FCS starters last year. The median was 7.30. We are well below the median this year at only 7.05. Last season's 8.66 ranked 16th among them.
Per attempt, where yards per attempt lives, YAC is still the biggest piece: 0.93 of the 1.61 yards an attempt he has lost since last season, 58 percent. Completing fewer passes is another 0.40, and shorter catches are the last 0.29. Most of the completion drop is the deep ball, more on that below.
It is also why he is throwing more. Last season Ah Yat averaged 31.3 attempts and 271 yards a game. This season it's 35.8 attempts and 252 yards. Those four and a half extra throws a game, at this year's 7.05, are worth about 31 yards. The YAC that went missing is worth about 32 a game. Same four-game window as last season: 30 more attempts, 16 more completions, 78 fewer yards.
The screen game is fine. Throws at or behind the line are getting 9.67 yards after the catch against 8.37 last season, and 7.16 with Eli's 85-yarder against Southern Utah taken out. The damage is past the line. On a 10-to-19-yard completion, the throw that is supposed to turn into 30 sometimes, last year's catches got 7.38 after the catch. This year's get 1.45. Wortham alone was thrown 22 of those last season and caught 15 for 398 yards. This season Ah Yat has thrown 18 of them to everybody.
Take out everything thrown at or behind the line and last year's completions got 5.81 after the catch; this year's get 3.00. Take Wortham out of last season too and it's still 4.94. He is most of it, not all of it.
YAC is also where the big plays come from. Half of Ah Yat's 56 completions of 20 yards or more last season, 28 of them, were thrown shorter than 20 yards and became explosive after the catch. This year it's 3 of 9. And the team that wins the big-play battle, and wins it by a lot, wins the game: in FCS-against-FCS games last season, the team with five or more extra plays of 20-plus yards won 85 percent of the time. We feasted on that last year, 6.1 plays of 20 yards or more a game against 4.5 for our opponents, and we were 9-1 in the games where we had more. We haven't found it yet this year: 3.3 a game for us, 3.3 for them, and Oregon State had seven to our one.
Kitchel wanted completion percentage by depth of target.
@Kitchel__ on Xhttps://x.com/Kitchel__/status/2102439122204062020
This absolves Ah Yat of any blame. At or behind the line: 84 percent last year, 80 this year. Two to nine yards: 73 and 70. Ten to nineteen: 59 and 61. The one place it fell is past twenty yards, 47.5 percent last year and 30 this year, 6 of 20. He is completing what he completed last season everywhere but the deep ball, and what happens after the catch is what left.
I thought perhaps this year's throws were shorter because we are throwing to the backs more and running more screens. Wrong twice. Average depth of target counts every throw, incompletions included, where air yards a catch counts only the ones caught, and his is 7.9 this year against 7.6 last year. PFF has it at 8.6 against 8.1. The backs are getting 14.1 percent of his targets, down from 17.9. Throws at or behind the line are 28.9 percent of them, against 29.6. He is throwing it as far as he did last year. The air yards have dropped because we haven't dialed in the deep ball, yet. It may seem counterintuitive that our yards per attempt is lower when our aDOT is higher, but that's precisely because we haven't been getting the YAC or the deep balls. We're trying to push the ball downfield more often. It just hasn't paid off yet, because those throws aren't being completed.
Who gets the shots
Fifty-nine of Ah Yat's attempts last season were tagged deep, 20 air yards or more, 12.7 percent of his throws. And the reply I sent Schmidt holds up: 12 of Wortham's 22 explosive catches came on throws of 15 air yards or more, and the other 10 came on shorter throws he broke himself.
@schuylerwatt on Xhttps://x.com/schuylerwatt/status/2102457125419315221
The deep ball got rarer as last season went on: 4.75 deep shots a game in September, 4.50 in October, 2.75 in November, 3.67 in the playoffs. The completion rate never beat September's 58 percent. The offense that got to December got there on the short game and the catch-and-run. This year we are taking 5.00 deep shots a game, more than in any stretch of last season, but only landing 30 percent.
Brooks Davis is the deep target, same as he was as a freshman: an 11.7-yard average depth of target this year, 12 deep targets, 4 caught. He catches it where it's thrown, 5.0 yards after the catch this year and 4.7 last year, which is a different job from Wortham's. On last season's 10-to-19-yard throws Davis averaged half a yard after the catch. Wortham averaged 11.9.
Korbin Hendrix caught 2 of his 3 deep targets last season, for 49 and 29 yards. He has not seen the field much yet this season, but he is a huge target and has sprinter speed and could be an answer to the deep ball problem if his blocking and overall game can get him on the field. Jordan Dever was actually our best YAC receiver last season, on a small sample: nine catches on 13 targets for 192 yards, 12.0 after the catch per grab, better than Wortham's 8.9. Two of those were intermediate throws he took for 62 and 41. He hasn't gotten much run this year: 2 targets, zero catches. Eli is averaging 16.2 after the catch this year, but a more modest 5.7 with the 85-yard season-opening catch taken out.
| 2025 | Pos | Tgt | Rec-ydsRec | YAC/c | 20+ yd catches20+ yds |
|---|---|---|---|---|---|
| Brooks Davis | WR | 81 | 54-698 | 4.7 | 11 |
| Lekeldrick Bridges | WR | 3 | 0-0 | — | 0 |
| Eli Gillman | RB | 43 | 32-220 | 8.8 | 0 |
| Jordan Dever | WR | 13 | 9-192 | 12.0 | 3 |
| Korbin Hendrix | WR | 14 | 9-129 | 4.2 | 2 |
| Michael Wortham (gone) | WR | 106 | 85-1243 | 8.9 | 22 |
| 2026 | Pos | Tgt | Rec-ydsRec | YAC/c | 20+ yd catches20+ yds |
|---|---|---|---|---|---|
| Brooks Davis | WR | 50 | 35-446 | 5.0 | 6 |
| Lekeldrick Bridges | WR | 21 | 14-156 | 4.9 | 1 |
| Landon Ransom-Goelz | WR | 20 | 11-113 | 2.9 | 1 |
| Mariano Birdno | TE | 13 | 9-85 | 4.7 | 0 |
| Eli Gillman | RB | 13 | 8-120 | 16.2 | 1 |
| Jordan Dever | WR | 2 | 0-0 | — | 0 |
| Korbin Hendrix | WR | 0 | — | — | — |
What fixes it
Get the ball over the middle. Last season 19 percent of Ah Yat's targets went there, 88 throws, and they were his best throws: 10.1 yards an attempt, better than either sideline. This year it's 13 throws in four games, 9 percent. A slant or a dig in front of the safeties is a catch on the run, and a catch on the run is where YAC comes from. Nobody on this roster is Wortham, so the scheme has to manufacture what he made on his own: crossers and option routes that put Bridges and Davis in space with a head of steam, and Eli out of the backfield on more than screens. Then take the deep shots over the top when the safeties are jumping the deep middle routes.
I believe this is something we can fix schematically, but it is the cause of most of our early season offensive struggles. Our line has graded better in both pass and run. Our rushing game is averaging more yards per carry. Throw it over the middle, let somebody run with it, and the Ah Yacht Club is back on open water.